At work we use memcache as our local variable cache and the excellent memcache.php from Harun Yayli to give us a simple way of viewing what’s in the cache.
One use case we came up with that was missing from the original memcached.php script was a way to group similar variables and see how much of the cache they’re taking up. For example, for searches done on the site, we generate a key by concatenating search- to an md5 of the SQL, then store the result of that query in the cache with that key. Another example might be to cache an ad, so the key could be ad-1234, for the ad with ID 1234. So, the following code changes are going to enable us to see how much space all the ‘search’ data, ‘ad’ data etc. takes up in comparison to each other.
It works by starting off with a list of known key prefixes (i.e. search- and ad- in the examples above), then uses existing memcache commands to get a list of slabs, then queries each slab for each item it contains. From this list of items, it looks for our known keys, calculates the size of the item and adds it to a running total. Once it has all the totals, it generates a nice pie chart with a legend, using Google’s Chart API.
So, first up we need to add a new menu entry to our menu, to link to our breakdown. This is simply done by editing the getMenu function in src/display.functions.php and adding a new menu entry to it, as follows:
1 2 | // after the line for Slabs echo menu_entry(16, 'Breakdown'); |
Next up, we need to add the big block of code that’s going to generate our pie chart. You’ll see in memcache.php a switch block around $_GET['op']. This is where we want to add our block for our new operation 16, as follows:
1 2 3 4 5 6 7 8 9 10 11 12 13 14 15 16 17 18 19 20 21 22 23 24 25 26 27 28 29 30 31 32 33 34 35 36 37 38 39 40 41 42 43 44 45 46 47 48 49 50 51 52 53 54 55 56 57 58 59 60 61 62 63 64 65 66 67 68 69 70 71 72 73 74 75 76 77 78 79 80 81 82 83 84 85 86 87 88 89 90 91 92 93 94 95 96 97 98 99 100 101 | <?php switch ($_GET['op']) { // other code... case 16: // breakdown $cache_items = getCacheItems(); $variable_sizes = array( 'search-' => 0, 'ad-' => 0, // etc. 'other' => 0 // for everything that's left over ); $variable_keys = array_keys($variable_sizes); $other = 0; foreach ($cache_items['items'] as $server => $slabs) { foreach ($slabs as $slab_id => $slab) { $items = dumpCacheSlab($server, $slab_id, $slab['number']); foreach ($items['ITEM'] as $key => $item) { $expiry = trim($item, '[ ]'); $expiry = substr($expiry, strpos($expiry, ';')+2); $expiry = substr($expiry, 0, strpos($expiry, ' ')); $r = sendMemcacheCommand($h, $p, 'get '.$key); if (!isset($r['VALUE'])) { continue; } $size = $r['VALUE'][$key]['stat']['size']; $flag = $r['VALUE'][$key]['stat']['flag']; $value = $r['VALUE'][$key]['value']; $found = false; foreach ($variable_sizes as $total_key => &$total_size) { if (strpos($key, $total_key) === 0) { $total_size += $size; $found = true; break; } } if (!$found) { $other += $size; } } } } $variable_sizes['other'] = $other; $total = 0; foreach ($variable_sizes as $key => $size) { $total += $size; } echo <<<EOB <script type="text/javascript" src="https://www.google.com/jsapi"></script><script type="text/javascript">// <![CDATA[ google.load("visualization", "1", {packages:["corechart"]}); google.setOnLoadCallback(drawChart); function drawChart() { var data = google.visualization.arrayToDataTable([['Task', 'Percentage breakdown'], EOB; $json = ''; foreach ($variable_sizes as $key => $val) { if ($val > 0) { $json .= "['".$key."', ".$val."],\n"; } } echo rtrim($json, "\n,"); echo <<<EOB ]); var options = { title: 'Percentage breakdown' }; var chart = new google.visualization.PieChart(document.getElementById('piechart')); chart.draw(data, options); } // ]]></script> <div id="piechart" style="width: 900px; height: 500px; float: left;"></div> EOB; $meanings = array( 'ad-' => 'Specifc ads', 'search-' => 'Search results queries', // etc. 'other' => 'Other small random bits of data' ); ?> <div style="float: left;"> <h2>Key meanings</h2> <table style="border: none;"> <?php $i = 0; foreach ($meanings as $key => $meaning) { ?> <tr<?php if (++$i % 2 == 0) echo ' style="background: #ddd;"'; ?>> <td><?php echo $key; ?></td> <td><?php echo $meaning; ?></td> </tr> <?php } ?> </table> </div> <?php break; |
So, now you should see a new menu option and clicking on it, should hopefully bring up a nice pie chart, something like the screenshot below (I’ve had to blur out our cache variable names).
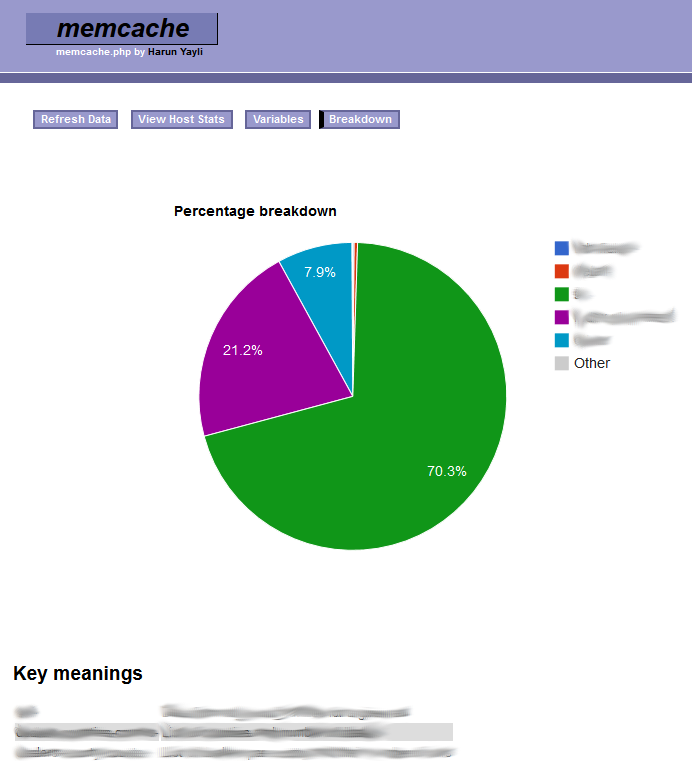
Memcache Breakdown
No Comments
Leave a reply
You must be logged in to post a comment.